💻 Programming
There are two main programming methods supported and tested with the Smart Powermeter:
ESPHome
Arduino
In both scenarios, and if you are using the USB port or the Serial port for programming it, you will first need to enter the board into flashing mode: press and hold the Flash pushbutton while you reset the board (pressing once the Reset pushbutton).
Caution
When flashing the board, make sure its only powered by the USB/Serial port.
ESPHome
ESPHome is a well known platform for programming ESP-based devices with a very little effort. It is configured via YAML files and supports a wide range of functionalities and sensors.
Important
For using ESPHome, and all its funcionalities, you need to have a Home Assistant instance running in the same network as your Smart Powermeter.
The Smart Powermeter comes raw, without any firmware by default, therefore, you will need to flash it for first time. There are many ways to flash your ESPHome device (locally, ESPHome Web), but the one I strongly recommend is the one through the ESPHome Add-on for Home Assistant:
Make sure your ESPHome Add-on for HA is up to date and working.
Add a new device, enter the name you want (like Smart-Powermeter), and skip the next step.
Select the ESP32-S2 as the device type, skip the last step (installation). You will have created a provisional first configuration YAML file.
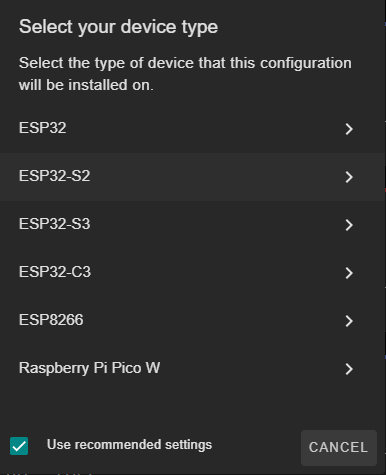
Open the recently created file and replace the content with the example configuration
smart-powermeter.yaml
Note
You might need to keep the encription keys OTA and API
  1substitutions:
  2  device_name: "smart-powermeter"
  3  friendly_name: "Smart Powermeter"
  4  project_name: "smart.powermeter"
  5  project_version: "2.0"
  6  ap_ssid: "Smart-Powermeter"
  7  ap_pwd: "smartpowermeter"
  8
  9esphome:
 10  name: "${device_name}"
 11  name_add_mac_suffix: true
 12  project:
 13    name: "${project_name}"
 14    version: "${project_version}"
 15
 16esp32:
 17  board: esp32-s2-saola-1
 18  framework:
 19    type: arduino
 20
 21# Enable logging
 22logger:
 23
 24# Enable Home Assistant API
 25api:
 26
 27# Enable Over The Air updates
 28ota:
 29
 30
 31#Public location of this yaml file
 32dashboard_import:
 33  package_import_url: github://JGAguado/Smart_Powermeter/docs/source/files/configuration.yaml@V2R1
 34  import_full_config: true
 35
 36# Enable fallback hotspot (captive portal) in case wifi connection fails
 37captive_portal:
 38
 39
 40improv_serial:
 41
 42wifi:
 43  ap:
 44    ssid: "${ap_ssid}"
 45    password: "${ap_pwd}"
 46
 47time:
 48  - platform: homeassistant
 49    id: esptime
 50
 51sensor:
 52  - platform: adc
 53    pin: GPIO1
 54    id: Input_1
 55    attenuation: 11db
 56    update_interval: 1s
 57
 58  - platform: adc
 59    pin: GPIO2
 60    id: Input_2
 61    attenuation: 11db
 62    update_interval: 1s
 63
 64  - platform: adc
 65    pin: GPIO3
 66    id: Input_3
 67    attenuation: 11db
 68    update_interval: 1s
 69
 70  - platform: adc
 71    pin: GPIO4
 72    id: Input_4
 73    attenuation: 11db
 74    update_interval: 1s
 75
 76  - platform: adc
 77    pin: GPIO5
 78    id: Input_5
 79    attenuation: 11db
 80    update_interval: 1s
 81
 82  - platform: adc
 83    pin: GPIO6
 84    id: Input_6
 85    attenuation: 11db
 86    update_interval: 1s
 87
 88  - platform: ct_clamp
 89    sensor: Input_1
 90    id: Probe_1
 91    name: "Probe 1"
 92    sample_duration: 200ms
 93    update_interval: 1s
 94    filters:
 95      - calibrate_linear:
 96          - 0 -> 0
 97          - 0.042 -> 2.72
 98
 99  - platform: ct_clamp
100    sensor: Input_2
101    name: "Probe 2"
102    id: Probe_2
103    sample_duration: 200ms
104    update_interval: 1s
105    filters:
106      - calibrate_linear:
107          - 0 -> 0
108          - 0.033 -> 1.07
109
110  - platform: ct_clamp
111    sensor: Input_3
112    name: "Probe 3"
113    id: Probe_3
114    sample_duration: 200ms
115    update_interval: 1s
116    filters:
117      - calibrate_linear:
118          - 0 -> 0
119          - 0.022 -> 0.66
120
121  - platform: ct_clamp
122    sensor: Input_4
123    name: "Probe 4"
124    id: Probe_4
125    sample_duration: 200ms
126    update_interval: 1s
127    filters:
128      - calibrate_linear:
129          - 0 -> 0
130          - 0.022 -> 0.66
131
132  - platform: ct_clamp
133    sensor: Input_5
134    name: "Probe 5"
135    id: Probe_5
136    sample_duration: 200ms
137    update_interval: 1s
138    filters:
139      - calibrate_linear:
140          - 0 -> 0
141          - 0.022 -> 0.66
142
143  - platform: ct_clamp
144    sensor: Input_6
145    name: "Probe 6"
146    id: Probe_6
147    sample_duration: 200ms
148    update_interval: 1s
149    filters:
150      - calibrate_linear:
151          - 0 -> 0
152          - 0.022 -> 0.66
153
154  - platform: total_daily_energy
155    name: "Total Daily Power"
156    power_id: current_power
157    id: daily_power
158
159  - platform: template
160    id: current_power
161    name: "Measured Power"
162    lambda: return (id(Probe_1).state + id(Probe_2).state + id(Probe_3).state) * 230.0 / 1000; #Power = Current * Voltage
163    unit_of_measurement: 'kW'
164    update_interval: 5s
165
166  # WiFi Signal
167  - platform: wifi_signal
168    name: "WiFi Signal Sensor"
169    id: wifisignal
170    update_interval: 20s
171
172
173
174font:
175  - file: "gfonts://Audiowide"
176    id: font_header
177    size: 15
178  - file: "gfonts://Audiowide"
179    id: font_gauge
180    size: 15
181  - file: "gfonts://Audiowide"
182    id: font_text
183    size: 15
184  - file: 'gfonts://Material+Symbols+Outlined'
185    id: font_icon
186    size: 18
187    glyphs:
188      - "\U0000f0b0" # wifi-strength-0
189      - "\U0000ebe4" # wifi-strength-1
190      - "\U0000ebd6" # wifi-strength-2
191      - "\U0000ebe1" # wifi-strength-3
192      - "\U0000e1d8" # wifi-strength-4
193
194spi:
195  clk_pin: GPIO12
196  mosi_pin: GPIO11  # Works on the e-paper
197
198image:
199  - file: https://smart-powermeter.readthedocs.io/en/v2r2/_images/Gauge.png
200    id: gauge
201
202  - file: https://smart-powermeter.readthedocs.io/en/v2r2/_images/Gauge_1.png
203    id: gauge_1
204
205  - file: mdi:home-lightning-bolt
206    id: power
207    resize: 18x18
208
209  - file: mdi:cash-multiple
210    id: cash
211    resize: 18x18
212
213  - file: mdi:currency-eur
214    id: euro
215    resize: 18x18
216
217  - file: mdi:lightning-bolt
218    id: bolt
219    resize: 22x22
220
221display:
222  - platform: waveshare_epaper
223    cs_pin: GPIO10
224    dc_pin: GPIO13
225    busy_pin: GPIO14
226    reset_pin: GPIO15
227    model: 2.90inv2
228    rotation: 270
229    update_interval: 1min
230    full_update_every: 1
231    pages:
232      - id: page1
233        lambda: |-
234          #define H_LEFT_MARGIN 4
235          #define H_RIGHT_MARGIN 280
236          #define H_CENTER 128
237          #define V_WEATHER 0
238          #define V_CLOCK 1
239          #define V_WIFI 30
240          #define V_VOLTAGE 60
241          #define V_BATTERY  90
242
243          // WiFi quality
244          // it.image(0, 0, id(background));
245
246          // Time
247          int x_head = 260;
248          int y_head = 2;
249          it.strftime(x_head, y_head, id(font_header), TextAlign::TOP_RIGHT,
250          "%H:%M", id(esptime).now());
251
252          // WiFi quality
253          if(id(wifisignal).has_state ()) {
254            if (id(wifisignal).state >= -50) {
255                // Excellent # mdi-wifi-strength-4
256                it.printf(x_head, y_head, id(font_icon), TextAlign::TOP_LEFT, "\U0000e1d8");
257            } else if (id(wifisignal).state  >= -60) {
258                //Good # mdi-wifi-strength-3
259                it.printf(x_head, y_head, id(font_icon), TextAlign::TOP_LEFT, "\U0000ebe1");
260            } else if (id(wifisignal).state  >= -67) {
261                //Fair # mdi-wifi-strength-2
262                it.printf(x_head, y_head, id(font_icon), TextAlign::TOP_LEFT, "\U0000ebd6");
263            } else if (id(wifisignal).state  >= -70) {
264                //Weak # mdi-wifi-strength-1
265                it.printf(x_head, y_head, id(font_icon), TextAlign::TOP_LEFT, "\U0000ebe4");
266            } else {
267                //Unlikely working mdi-wifi-strength-0
268                it.printf(x_head, y_head, id(font_icon), TextAlign::TOP_LEFT, "\U0000f0b0");
269            }
270          }
271
272          // Gauges
273          // General parameters
274          float pi = 3.141592653589793;
275          float alpha = 4.71238898038469; // Defined as the gauge angle in radians (270deg)
276          float beta = 2*pi - alpha;
277          int radius = 25;              // Radius of the gauge in pixels
278          int thick = 7;                // Size of the marker
279
280          // Probe 1
281          int min_range = 0;
282          int max_range = 10;
283          int xc = 40;
284          int yc = 33;
285
286          it.image(xc-radius, yc-radius, id(gauge));
287
288          float measured = id(Probe_1).state;
289
290          if (measured < min_range) {
291            measured = min_range;
292          }
293          if (measured > max_range) {
294            measured = max_range;
295          }
296
297          float val = (measured - min_range) / abs(max_range - min_range) * alpha;
298          int x0 = static_cast<int>(xc + radius * cos(pi / 2 + beta / 2 + val));
299          int y0 = static_cast<int>(yc + radius * sin(pi / 2 + beta / 2 + val));
300          int x1 = static_cast<int>(xc + (radius+thick) * cos(pi / 2 + beta / 2 + val + 0.1));
301          int y1 = static_cast<int>(yc + (radius+thick) * sin(pi / 2 + beta / 2 + val + 0.1));
302          int x2 = static_cast<int>(xc + (radius+thick) * cos(pi / 2 + beta / 2 + val - 0.1));
303          int y2 = static_cast<int>(yc + (radius+thick) * sin(pi / 2 + beta / 2 + val - 0.1));
304          it.line(x0, y0, x1, y1);
305          it.line(x1, y1, x2, y2);
306          it.line(x2, y2, x0, y0);
307
308
309          it.printf(xc, yc, id(font_gauge), TextAlign::CENTER,
310          "1");
311          it.printf(xc, yc + radius*0.75, id(font_gauge), TextAlign::TOP_CENTER,
312          "%.1fA", measured);
313
314          // Probe 2
315          min_range = 0;
316          max_range = 10;
317          xc = 100;
318          yc = 33;
319
320          it.image(xc-radius, yc-radius, id(gauge));
321
322
323          measured = id(Probe_2).state;
324
325          if (measured < min_range) {
326            measured = min_range;
327          }
328          if (measured > max_range) {
329            measured = max_range;
330          }
331
332          val = (measured - min_range) / abs(max_range - min_range) * alpha;
333          x0 = static_cast<int>(xc + radius * cos(pi / 2 + beta / 2 + val));
334          y0 = static_cast<int>(yc + radius * sin(pi / 2 + beta / 2 + val));
335          x1 = static_cast<int>(xc + (radius+thick) * cos(pi / 2 + beta / 2 + val + 0.1));
336          y1 = static_cast<int>(yc + (radius+thick) * sin(pi / 2 + beta / 2 + val + 0.1));
337          x2 = static_cast<int>(xc + (radius+thick) * cos(pi / 2 + beta / 2 + val - 0.1));
338          y2 = static_cast<int>(yc + (radius+thick) * sin(pi / 2 + beta / 2 + val - 0.1));
339          it.line(x0, y0, x1, y1);
340          it.line(x1, y1, x2, y2);
341          it.line(x2, y2, x0, y0);
342
343
344          it.printf(xc, yc, id(font_gauge), TextAlign::CENTER,
345          "2");
346          it.printf(xc, yc  + radius*0.75, id(font_gauge), TextAlign::TOP_CENTER,
347          "%.1fA", measured);
348
349          // Probe 3
350          min_range = 0;
351          max_range = 10;
352          xc = 160;
353          yc = 33;
354
355          it.image(xc-radius, yc-radius, id(gauge));
356
357
358          measured = id(Probe_3).state;
359
360          if (measured < min_range) {
361            measured = min_range;
362          }
363          if (measured > max_range) {
364            measured = max_range;
365          }
366
367          val = (measured - min_range) / abs(max_range - min_range) * alpha;
368          x0 = static_cast<int>(xc + radius * cos(pi / 2 + beta / 2 + val));
369          y0 = static_cast<int>(yc + radius * sin(pi / 2 + beta / 2 + val));
370          x1 = static_cast<int>(xc + (radius+thick) * cos(pi / 2 + beta / 2 + val + 0.1));
371          y1 = static_cast<int>(yc + (radius+thick) * sin(pi / 2 + beta / 2 + val + 0.1));
372          x2 = static_cast<int>(xc + (radius+thick) * cos(pi / 2 + beta / 2 + val - 0.1));
373          y2 = static_cast<int>(yc + (radius+thick) * sin(pi / 2 + beta / 2 + val - 0.1));
374          it.line(x0, y0, x1, y1);
375          it.line(x1, y1, x2, y2);
376          it.line(x2, y2, x0, y0);
377
378
379          it.printf(xc, yc, id(font_gauge), TextAlign::CENTER,
380          "3");
381          it.printf(xc, yc  + radius*0.75, id(font_gauge), TextAlign::TOP_CENTER,
382          "%.1fA", measured);
383
384          // Probe 4
385          min_range = 0;
386          max_range = 10;
387          xc = 40;
388          yc = 95;
389
390          it.image(xc-radius, yc-radius, id(gauge));
391
392
393          measured = id(Probe_4).state;
394
395
396          if (measured < min_range) {
397            measured = min_range;
398          }
399          if (measured > max_range) {
400            measured = max_range;
401          }
402
403          val = (measured - min_range) / abs(max_range - min_range) * alpha;
404          x0 = static_cast<int>(xc + radius * cos(pi / 2 + beta / 2 + val));
405          y0 = static_cast<int>(yc + radius * sin(pi / 2 + beta / 2 + val));
406          x1 = static_cast<int>(xc + (radius+thick) * cos(pi / 2 + beta / 2 + val + 0.1));
407          y1 = static_cast<int>(yc + (radius+thick) * sin(pi / 2 + beta / 2 + val + 0.1));
408          x2 = static_cast<int>(xc + (radius+thick) * cos(pi / 2 + beta / 2 + val - 0.1));
409          y2 = static_cast<int>(yc + (radius+thick) * sin(pi / 2 + beta / 2 + val - 0.1));
410          it.line(x0, y0, x1, y1);
411          it.line(x1, y1, x2, y2);
412          it.line(x2, y2, x0, y0);
413
414
415          it.printf(xc, yc, id(font_gauge), TextAlign::CENTER,
416          "4");
417          it.printf(xc, yc  + radius*0.75, id(font_gauge), TextAlign::TOP_CENTER,
418          "%.1fA", measured);
419
420          // Probe 5
421          min_range = 0;
422          max_range = 10;
423          xc = 100;
424          yc = 95;
425
426          it.image(xc-radius, yc-radius, id(gauge));
427
428
429          measured = id(Probe_5).state;
430
431
432          if (measured < min_range) {
433            measured = min_range;
434          }
435          if (measured > max_range) {
436            measured = max_range;
437          }
438
439          val = (measured - min_range) / abs(max_range - min_range) * alpha;
440          x0 = static_cast<int>(xc + radius * cos(pi / 2 + beta / 2 + val));
441          y0 = static_cast<int>(yc + radius * sin(pi / 2 + beta / 2 + val));
442          x1 = static_cast<int>(xc + (radius+thick) * cos(pi / 2 + beta / 2 + val + 0.1));
443          y1 = static_cast<int>(yc + (radius+thick) * sin(pi / 2 + beta / 2 + val + 0.1));
444          x2 = static_cast<int>(xc + (radius+thick) * cos(pi / 2 + beta / 2 + val - 0.1));
445          y2 = static_cast<int>(yc + (radius+thick) * sin(pi / 2 + beta / 2 + val - 0.1));
446          it.line(x0, y0, x1, y1);
447          it.line(x1, y1, x2, y2);
448          it.line(x2, y2, x0, y0);
449
450
451          it.printf(xc, yc, id(font_gauge), TextAlign::CENTER,
452          "5");
453          it.printf(xc, yc  + radius*0.75, id(font_gauge), TextAlign::TOP_CENTER,
454          "%.1fA", measured);
455
456          // Probe 6
457          min_range = 0;
458          max_range = 10;
459          xc = 160;
460          yc = 95;
461
462          it.image(xc-radius, yc-radius, id(gauge));
463
464
465          measured = id(Probe_6).state;
466
467
468          if (measured < min_range) {
469            measured = min_range;
470          }
471          if (measured > max_range) {
472            measured = max_range;
473          }
474
475          val = (measured - min_range) / abs(max_range - min_range) * alpha;
476          x0 = static_cast<int>(xc + radius * cos(pi / 2 + beta / 2 + val));
477          y0 = static_cast<int>(yc + radius * sin(pi / 2 + beta / 2 + val));
478          x1 = static_cast<int>(xc + (radius+thick) * cos(pi / 2 + beta / 2 + val + 0.1));
479          y1 = static_cast<int>(yc + (radius+thick) * sin(pi / 2 + beta / 2 + val + 0.1));
480          x2 = static_cast<int>(xc + (radius+thick) * cos(pi / 2 + beta / 2 + val - 0.1));
481          y2 = static_cast<int>(yc + (radius+thick) * sin(pi / 2 + beta / 2 + val - 0.1));
482          it.line(x0, y0, x1, y1);
483          it.line(x1, y1, x2, y2);
484          it.line(x2, y2, x0, y0);
485
486
487          it.printf(xc, yc, id(font_gauge), TextAlign::CENTER,
488          "6");
489          it.printf(xc, yc  + radius*0.75, id(font_gauge), TextAlign::TOP_CENTER,
490          "%.1fA", measured);
491
492
493          // Total parameters
494          // Power gauge
495          alpha = pi; // Defined as the gauge angle in radians (270deg)
496          beta = 2*pi - alpha;
497          radius = 40;              // Radius of the gauge in pixels
498          thick = 7;
499
500          min_range = 0;
501          max_range = 5;
502          xc = 245;
503          yc = 65;
504
505          it.image(xc-radius, yc-radius, id(gauge_1));
506
507          measured = id(current_power).state;
508
509          if (measured < min_range) {
510            measured = min_range;
511          }
512          if (measured > max_range) {
513            measured = max_range;
514          }
515
516          val = (measured - min_range) / abs(max_range - min_range) * alpha;
517          x0 = static_cast<int>(xc + radius * cos(pi / 2 + beta / 2 + val));
518          y0 = static_cast<int>(yc + radius * sin(pi / 2 + beta / 2 + val));
519          x1 = static_cast<int>(xc + (radius+thick) * cos(pi / 2 + beta / 2 + val + 0.1));
520          y1 = static_cast<int>(yc + (radius+thick) * sin(pi / 2 + beta / 2 + val + 0.1));
521          x2 = static_cast<int>(xc + (radius+thick) * cos(pi / 2 + beta / 2 + val - 0.1));
522          y2 = static_cast<int>(yc + (radius+thick) * sin(pi / 2 + beta / 2 + val - 0.1));
523          it.line(x0, y0, x1, y1);
524          it.line(x1, y1, x2, y2);
525          it.line(x2, y2, x0, y0);
526
527
528          it.image(xc-11, yc-22, id(bolt));
529
530          it.printf(xc, yc + radius/2, id(font_gauge), TextAlign::BOTTOM_CENTER,
531          "%.1fkW", measured);
532          // it.printf(xc, yc + radius/2, id(font_gauge), TextAlign::TOP_CENTER,
533          // "kW");
534
535          // Derivated parameters:
536          measured = id(daily_power).state;
537          it.printf(290, 85, id(font_gauge), TextAlign::TOP_RIGHT,
538          "%.0fkWh", measured);
539          it.image(200, 85, id(power));
Note
Gauge.png and Gauge.png are some customized gauges to be plotted as part of the background. You can download them to your local path, or just invoke the url as in the .yaml example.


Click on install, make sure that the the board is connected via the USB-C (and that it is into flashing mode, see up in this guide) to the device running the Home Assistant (in my case a Raspberry Pi) before selecting the mode of installation.
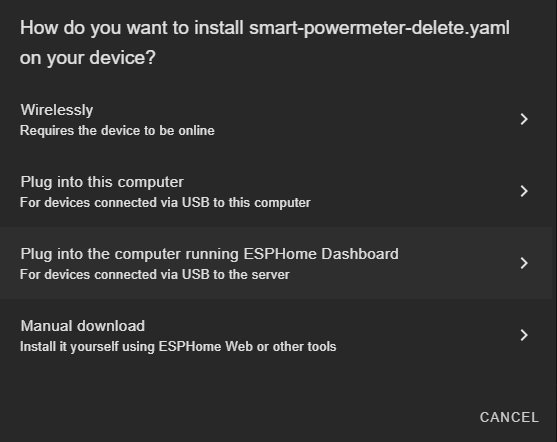
Select the Serial port and let it run, it might take some minutes.
Once it’s done, you will have to exit the flashing mode: press the Reset pushbutton once.
Now, your ESPHome-based Smart Powermeter should be ready to log data and stream it to your Home Assistant. Note that the current configuration is just an example and you can customize it at your will, including the calibration.
Tip
A very easy way to upload and copy files (code or even images) into your ESPHome folder hosted in your HA instance is with the help of the Visual Studio Code integration for HA. This way you can just drag and drop the files over the folder on the Home Assistant’s Visual Studio Code navigation panel on your left.
Flash Tools
If you want to deploy an ESPHome already compiled .bin image, you can use Espressif’s official Flash Download Tools to upload it into your Smart Powermeter.
As an example (and test) you can use this smart-powermeter-offline.bin image with the address 0x0, make sure DoNotChgBin is checked:

Note
Make sure that the checkbox close to the filepath is also checked!
Arduino
If you are still interested in programming directly with the Arduino IDE, the procedure is no different than with any other ESP32 devices:
Open the Arduino IDE and go to File -> Preferences option.
Add to the Additional Boards Manager URSLs the url:
https://dl.espressif.com/dl/package_esp32_index.json
Close the preferences and open in the menu Tools -> Board -> Boards Manager.
Search for esp32 and install it. This might take some time.
Now you can select the board ESP32S2 Dev Module as the target board. Leave the rest of parameters by default.
Select the correct port and remember to enter the board into flashing mode before uploading the sketch.